Americans’ Views on Political Violence – Key Findings & Recommendations
States United Action conducted a nationally representative survey of over 3,000 American adults in the week leading up the 2022 midterm elections.
In This Resource
Last updated: 6.15.2023
A Project of States United Action
While the 2022 midterms marked a recent bright spot for our democracy, they also highlighted new and emerging issues about political violence in America. Most recently, the indictments of former President Trump brought these issues to the forefront.
Issues of political violence and extremism are not new in American culture. But in the past four years we’ve seen an influx in efforts to use political violence to intimidate both voters and the people who run our elections.
In the 2022 midterms, this included continued threats against election officials, attempts to intimidate voters at drop boxes, and concerns about guns at the polls. Those efforts – and connected attempts to interfere with how votes are cast, counted, and certified – are still evolving. And Americans’ perspectives on political violence continue to evolve alongside them.
As a nonpartisan organization, States United seeks to help state officials, law enforcement leaders, and other key stakeholders better understand attitudes toward election-related violence in our country today. In late 2022, we conducted polling on Americans’ attitudes toward political violence with two goals. First, to corroborate results from previous polls, and second, to innovate and contribute to the emerging research on perceptions of political violence. Ultimately, we aim to support leaders, researchers, and the public with ways to effectively think about, talk about, and write about political violence.
States United Action conducted a nationally representative survey of over 3,000 American adults in the week leading up the 2022 midterm elections. In this survey, we defined political violence as the use of violence, threats, intimidation, or harassment to prevent others from exercising their full social or political rights. The results of this survey provide five key insights into how Americans think about political violence.
1. Americans see political violence as a problem.
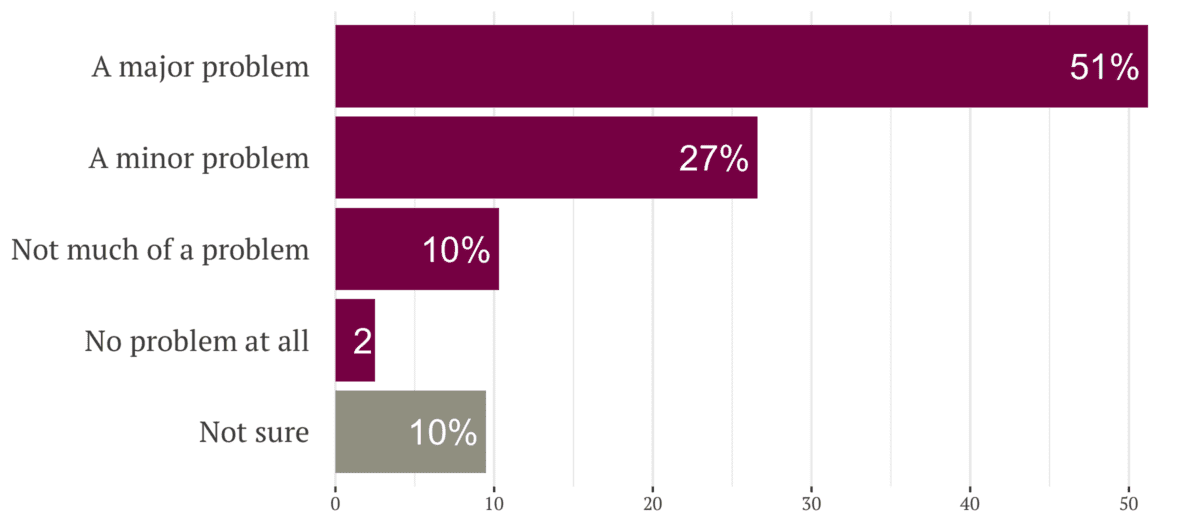
An overwhelming majority of respondents—78%—see political violence as a problem. More than half describe it as a “major” problem. Only 2% of Americans describe it as “no problem at all.” This level of concern is consistent with the results of another study conducted in early 2022, suggesting that Americans’ concerns about political violence do not change significantly based on proximity to the next election.
“[Political violence] happens when people use violence, threats, intimidation, or harassment to prevent others from exercising their full social or political rights. In this country, do you believe [political violence] is…?”
2. Americans’ support for political violence changes based on specific political circumstances.
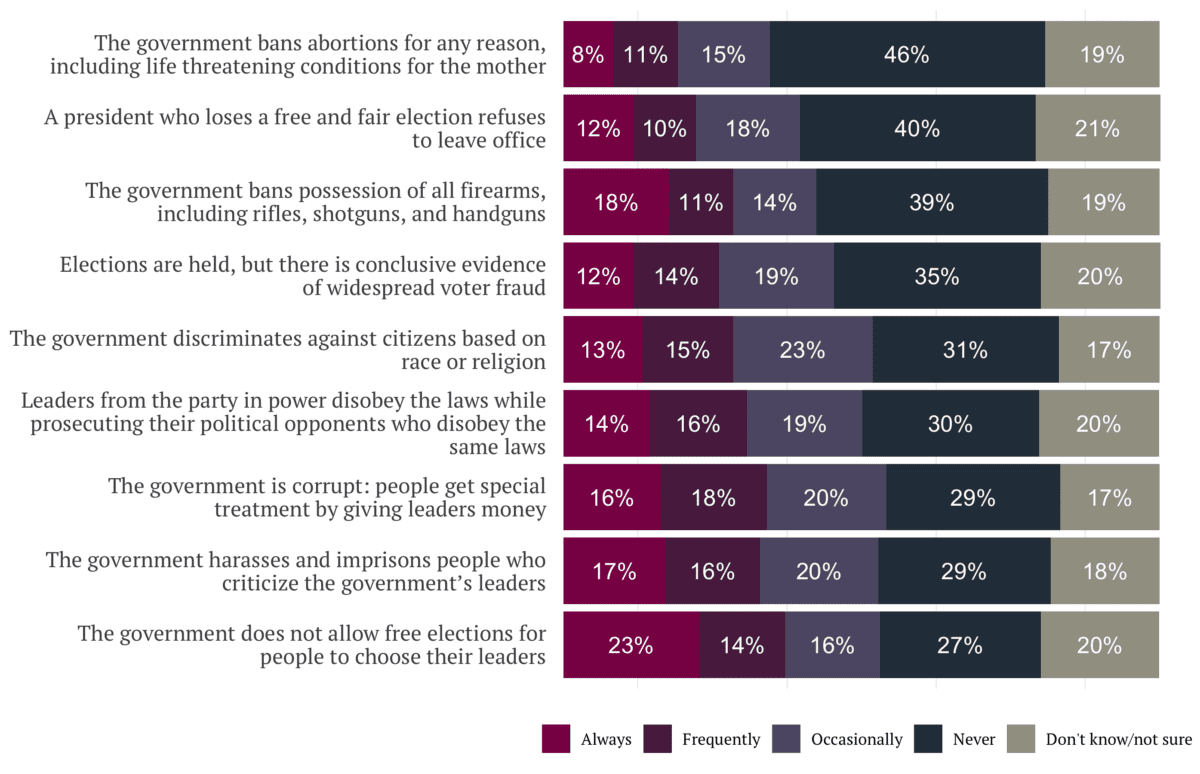
Even though most Americans view political violence as a problem, many believe that political violence is sometimes an acceptable response to specific political events. Significant numbers of Americans report that it is “always” acceptable to use violence in response to certain political scenarios. For example, 23% of respondents said that it would always be acceptable to use political violence if the government were to not allow free elections. The percentages of Americans who say that violence would be at least “occasionally” acceptable in specific contexts are even higher, ranging from 34% (if the government bans abortions for any reason) to 53% (if the government harasses and imprisons people who criticize government leaders).
“Below is a list of some conditions under which some people might believe it may be acceptable to use violence, threats, intimidation, or harassment to achieve their political goals. For each situation, please indicate when, if ever, you believe it would be acceptable to use political violence.”
3. Americans overwhelmingly reject specific acts of violence committed against everyday people.
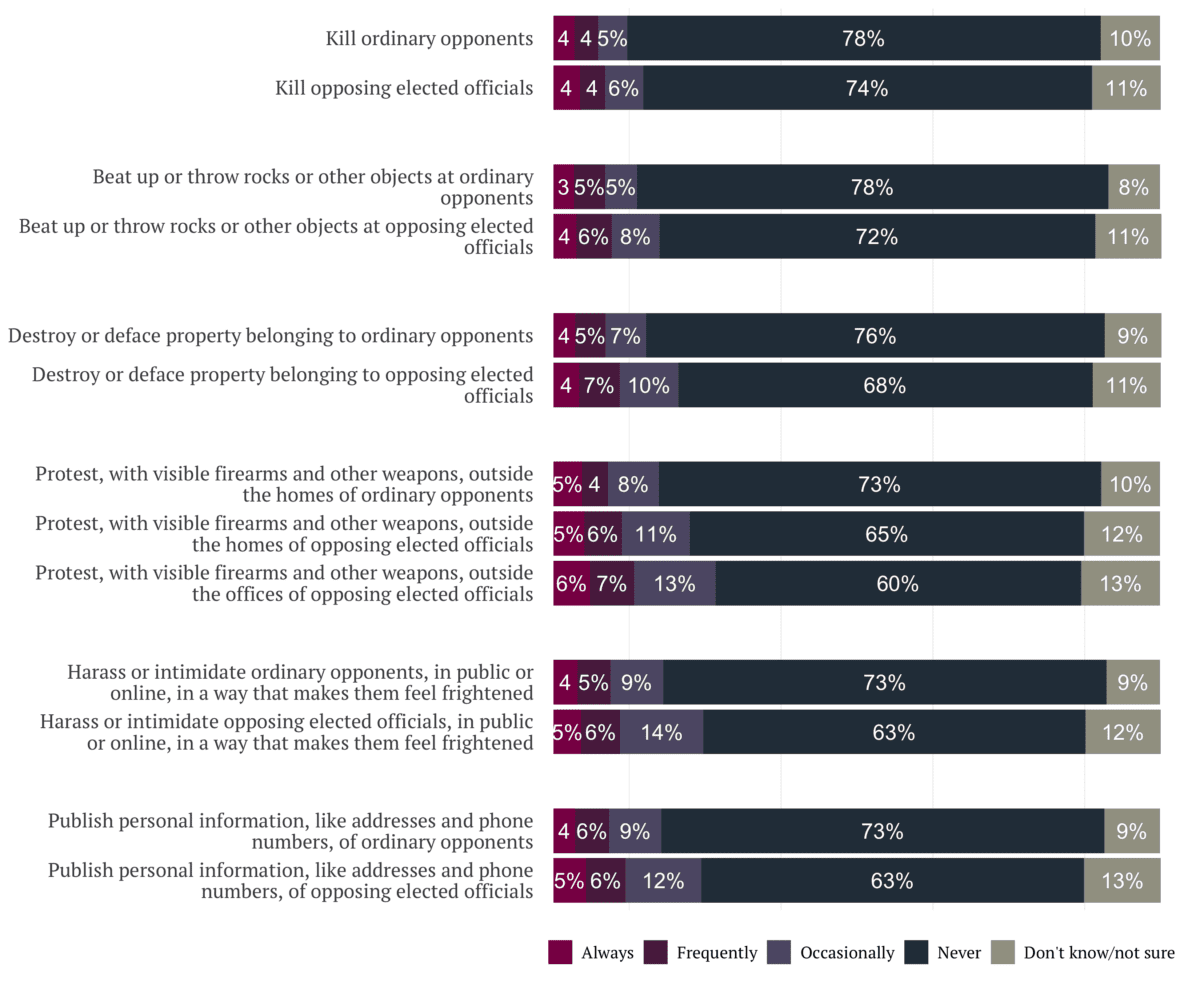
Americans overwhelmingly disapprove of specific violent acts committed against everyday people. Between 73% and 78% of respondents say that they would “never” support activities like killing, injuring, harassing, or doxxing ordinary people with whom they disagree politically. The highest percentage of respondents who say it would be at least “occasionally” acceptable to support a violent action committed against ordinary opponents is 19%.
However, respondents view violence against political leaders differently, rejecting violence targeting leaders at lower rates than violence targeting everyday people. Between 60% and 74% of respondents say that they would “never” support violent acts against opposing elected officials, and up to 26% report that they would find these actions at least “occasionally” acceptable.
“Below is a list of actions that some people might take to try to prevent others from exercising their full social or political rights. For each of the following actions, please indicate when, if ever, you believe it would be okay for [your political allies] to engage in these acts against [opposing elected officials].”
“Now, we’d like to ask you a similar question, but this time about actions that some [of your political allies] might take against [ordinary political opponents]. For each of the following actions, please indicate when, if ever, you believe it would be okay for [your political allies] to engage in these acts against [your ordinary political opponents].”
4. The context in which political violence occurs affects the extent to which Americans support or reject that violence.
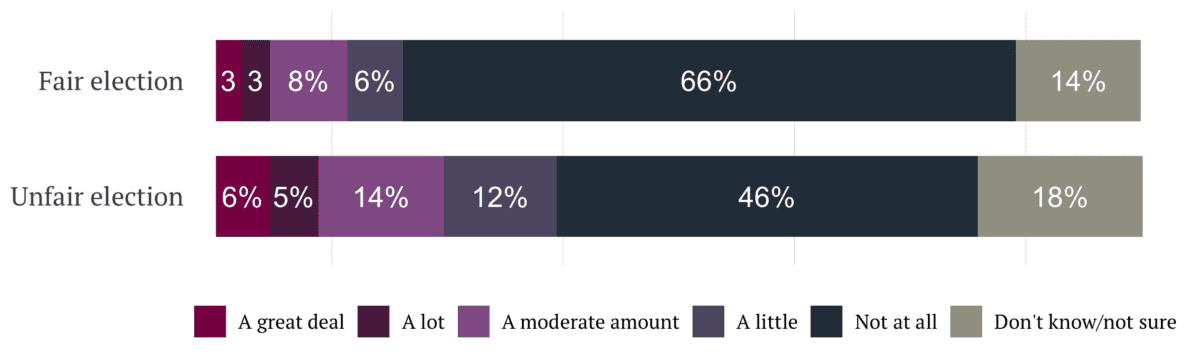
The context provided in political violence polling questions can dramatically influence respondents’ levels of support. We asked respondents to indicate their support for political violence in response to both fair and unfair hypothetical election losses. When respondents were asked about their support for violence if their preferred candidate for President were to lose the 2024 election fair and square, 20% said that violence could be at least “a little” justified. However, when respondents were asked about their support for violence if their preferred candidate were to lose because of “unfair actions” taken by their political opponents, support for violence nearly doubled to 37%.
“Thinking again on this topic, how justified do you think it would be for [your political allies] to use violence, threats, intimidation, or harassment if [your candidate for President] were to lose the 2024 election after all eligible votes were counted fairly?”
“What about if [your candidate for President] were to lose the 2024 election because of unfair actions taken by [your political opponents]? How justified, if at all, would it be for [your political allies] to use violence, threats, intimidation, or harassment then?”
5. Surveys may overstate how acceptable political violence is to Americans.
The ways in which respondents interact with a survey can influence our understanding of Americans’ support for political violence. Our survey included a question intended to measure how closely respondents were paying attention to the survey. Respondents who answered incorrectly were deemed “inattentive.” The survey also included a question intended to measure whether respondents answer questions based solely on their actual beliefs or may choose answers based on broader feelings of support or dislike for political actors. Respondents who indicated they answer surveys more based on their feelings than their true beliefs were characterized as “expressive.”
The combination of both “expressive” respondents and “inattentive” respondents is likely to generate survey results that may significantly overestimate broad support for political violence. Our results indicate that these two types of respondents can cause support for political violence to be overstated by an average of 43%. This indicates the importance of continuing to measure how respondents interact with surveys and how those interactions impact polling results.
The results from this survey provide practical guidance for leaders, researchers, and journalists as they continue to gauge support for political violence and offer solutions to protect Americans’ rights to engage safely in civic and political life.
Recommendations for leaders & elected officials
- Decades of research demonstrate that elected officials and other leaders have an outsized influence on public opinion. And from our survey results, we know that increased context and level of specificity about the type of violent acts are likely to reduce support for violence. In addition to thinking carefully about political violence, these leaders should be specific in describing the context for and type of political violence committed when speaking to the public. They should also work to humanize and draw connection with those impacted by violence.
- When condemning acts of political violence, leaders should explicitly name the type of harm suffered and describe the people impacted, because Americans report low levels of support for violence committed against specific individuals. Leaders should name those harmed if that information is a matter of public record and unlikely to contribute to further harm. Leaders should avoid describing instances of political violence in vague or broad terms.
- Following a legitimate election loss, losing candidates should emphasize in clear, unambiguous terms that their loss was a fair one, and that our elections are safe, secure, free, and fair. Losing candidates should avoid any insinuation that an election loss could be the result of fraud or nefarious actions committed by political opponents. This context helps shape how Americans respond to an election, and whether they view political violence as an acceptable potential response.
- Because a minority of Americans appear to find some violence against elected officials at least occasionally acceptable, elected officials and law enforcement officials should take threats seriously. The States United Democracy Center provides advice and guidelines for how to improve security for elected officials here.
Recommendations for researchers
- Researchers should continue to build on existing research and focus on replicating the results of prior polls to build confidence in accurate results.
- The context in which violence occurs likely affects Americans’ likelihood of supporting that violence. Ongoing research should focus on further determining how the context in which violence occurs impacts respondents’ attitudes.
- Researchers should continue to consider how to evaluate the extent to which concepts of fairness and unfairness in the political process impact opinions about when violence is acceptable.
- Researchers would be well-served to consider how respondents’ characteristics impact estimates of support for political violence. Researchers should include questions that capture how carefully respondents are paying attention to the survey, as well as whether respondents’ answers reflect their true beliefs or whether they may represent emotional allegiance to particular actors rather than actual support for violence. When fielding polls, researchers should investigate other ways to evaluate measurement error and provide insight as to the sincerity of responses provided by survey-takers.
- Researchers should devote more time to translating their findings in a way that provides actionable guidance for leaders who are in the best position to shape public opinion. Researchers should clearly communicate insights from existing research and tackle new areas of inquiry like developing and testing messages that could help allay the public’s fears about political violence.
Recommendations for journalists
- Journalists covering political violence – including trends and polling – should carefully note the language and context of political violence polling questions to provide accurate and nuanced reporting on those poll results.
- Journalists should acknowledge the potential for political violence surveys to overreport how acceptable violence is to Americans. They should raise questions and provide clarity on the ways researchers are trying to account for measurement error, to reduce misleading results.
- When covering incidents, journalists can mitigate harm from the increased attention on political violence by being as specific as possible in describing the context for violence and the actions committed, as well as humanizing the people impacted by violence.
- When covering elections, journalists must grapple with the fact that platforming false claims of unfairness in elections is likely to contribute to an increase in support for violence. Journalists can mitigate harm by not uplifting and repeating lies, or by contextualizing a candidate’s false claim of unfairness by including it only after emphasizing the facts in clear, unambiguous terms.
While political violence is not a new concept in American politics, Americans are experiencing episodes of, and conversations about, political violence in new ways. Polling on responses to political violence in the current environment is emerging and evolving, even as Americans’ perspectives on political violence change. As we head into the first presidential cycle following the January 6 insurrection, there is a need for ongoing research to evaluate current perspectives and to equip elected officials and leaders with the tools to prevent political violence, including effective language to use when talking about it. This survey is part of what must be a continuing effort to refine polling data and use that data to protect civil discourse and participation in the American political system.
“In the immediate lead up to the 2022 midterm elections, States United Action worked with YouGov to field an online poll of 3,049 adult American citizens. Participants were drawn from YouGov’s online panel and were interviewed between October 27th and November 3rd. Respondents were selected to be representative of American adults. Responses were additionally weighted to match population characteristics with respect to race/ethnicity, education, gender, age, U.S. Census region, and presidential vote choice in 2020. The weights range from 0.23 to 3.75, with a mean of 1 and a standard deviation of 0.48. The margin of error for this survey is approximately ± 2 percentage points. Therefore, sample estimates should differ from their expected value by less than the margin of error in 95% of all samples. This figure does not reflect non-sampling errors, including potential selection bias in panel participation or measurement error.
While YouGov fielded this survey, States United Action is solely responsible for any analysis included in this report. The question wordings and graphs presented above reflect estimates from combined experimental conditions. For more information about these experiments and question wordings, please contact info@statesunitedaction.org.