Surveying Americans on Accountability, Election Denial, and Democracy
In This Resource
A project of States United Action
To understand how Americans are thinking about key election questions, including ongoing accountability efforts for the attempt to overturn the 2020 election, States United Action, in partnership with YouGov, surveyed a nationally representative sample of U.S. adults in December 2023. We asked a variety of democracy-related questions, including about the upcoming election.
Here’s what we learned.
Americans support consequences for Trump’s lawyers.
Trump’s lawyers could lose their licenses, or face other professional consequences, for providing unlawful advice about overturning the 2020 election. In our survey, a plurality of respondents (45%) either strongly or somewhat supported these consequences, compared with 24% who strongly or somewhat opposed them.
Notably, almost twice as many Independents favored consequences rather than opposing them: 31% said they supported consequences, while 17% opposed them.
“As you may have heard, many of President Trump’s lawyers who helped with the legal efforts to overturn the 2020 election are facing consequences for their actions, including potentially losing their law licenses or facing other professional consequences. Generally speaking, how much would you say you [support or oppose] these kinds of professional consequences for attorneys who provided unlawful advice about how to overturn the 2020 election?”

More Americans believe the Trump prosecutions are about the facts than about politics.
We asked about criminal charges against Trump and his associates for their alleged conspiracy to overturn the 2020 election. More Americans said the charges were the result of a careful examination of the facts and evidence (39%) than said the charges were the result of anti-Trump political motivations (31%). An additional 19% said it was both.
These results broke into partisan differences: 64% of Democrats said the prosecutions were about the facts and the evidence, compared with only 13% of Republicans. Among independents, a narrow plurality said the charges were the result of the facts and the evidence.
“As you may know, former President Trump and some of his allies have been charged with multiple crimes related to their alleged conspiracy to overturn the results of the 2020 election. In your opinion, is it more likely that these charges are [a careful investigation of facts and evidence, or the political motivations of those who do not like President Trump]?”

Trump may lose significant support if he is sentenced to prison.
Even among people who already support Donald Trump in the 2024 presidential race, a substantial number (22%) indicated they may not vote for him if he is convicted of the election interference charges and sentenced to prison.
This group includes Trump supporters who said they would switch their votes to Joe Biden or another candidate, those would not vote at all, and those who said they weren’t sure.
Asked of respondents who said that they would vote for Donald Trump: “And if Donald Trump were convicted of these charges and sentenced to prison but were still the Republican nominee, would you vote for [Donald Trump, Joe Biden], someone else, or would you not vote?”

Americans don’t like election denial.
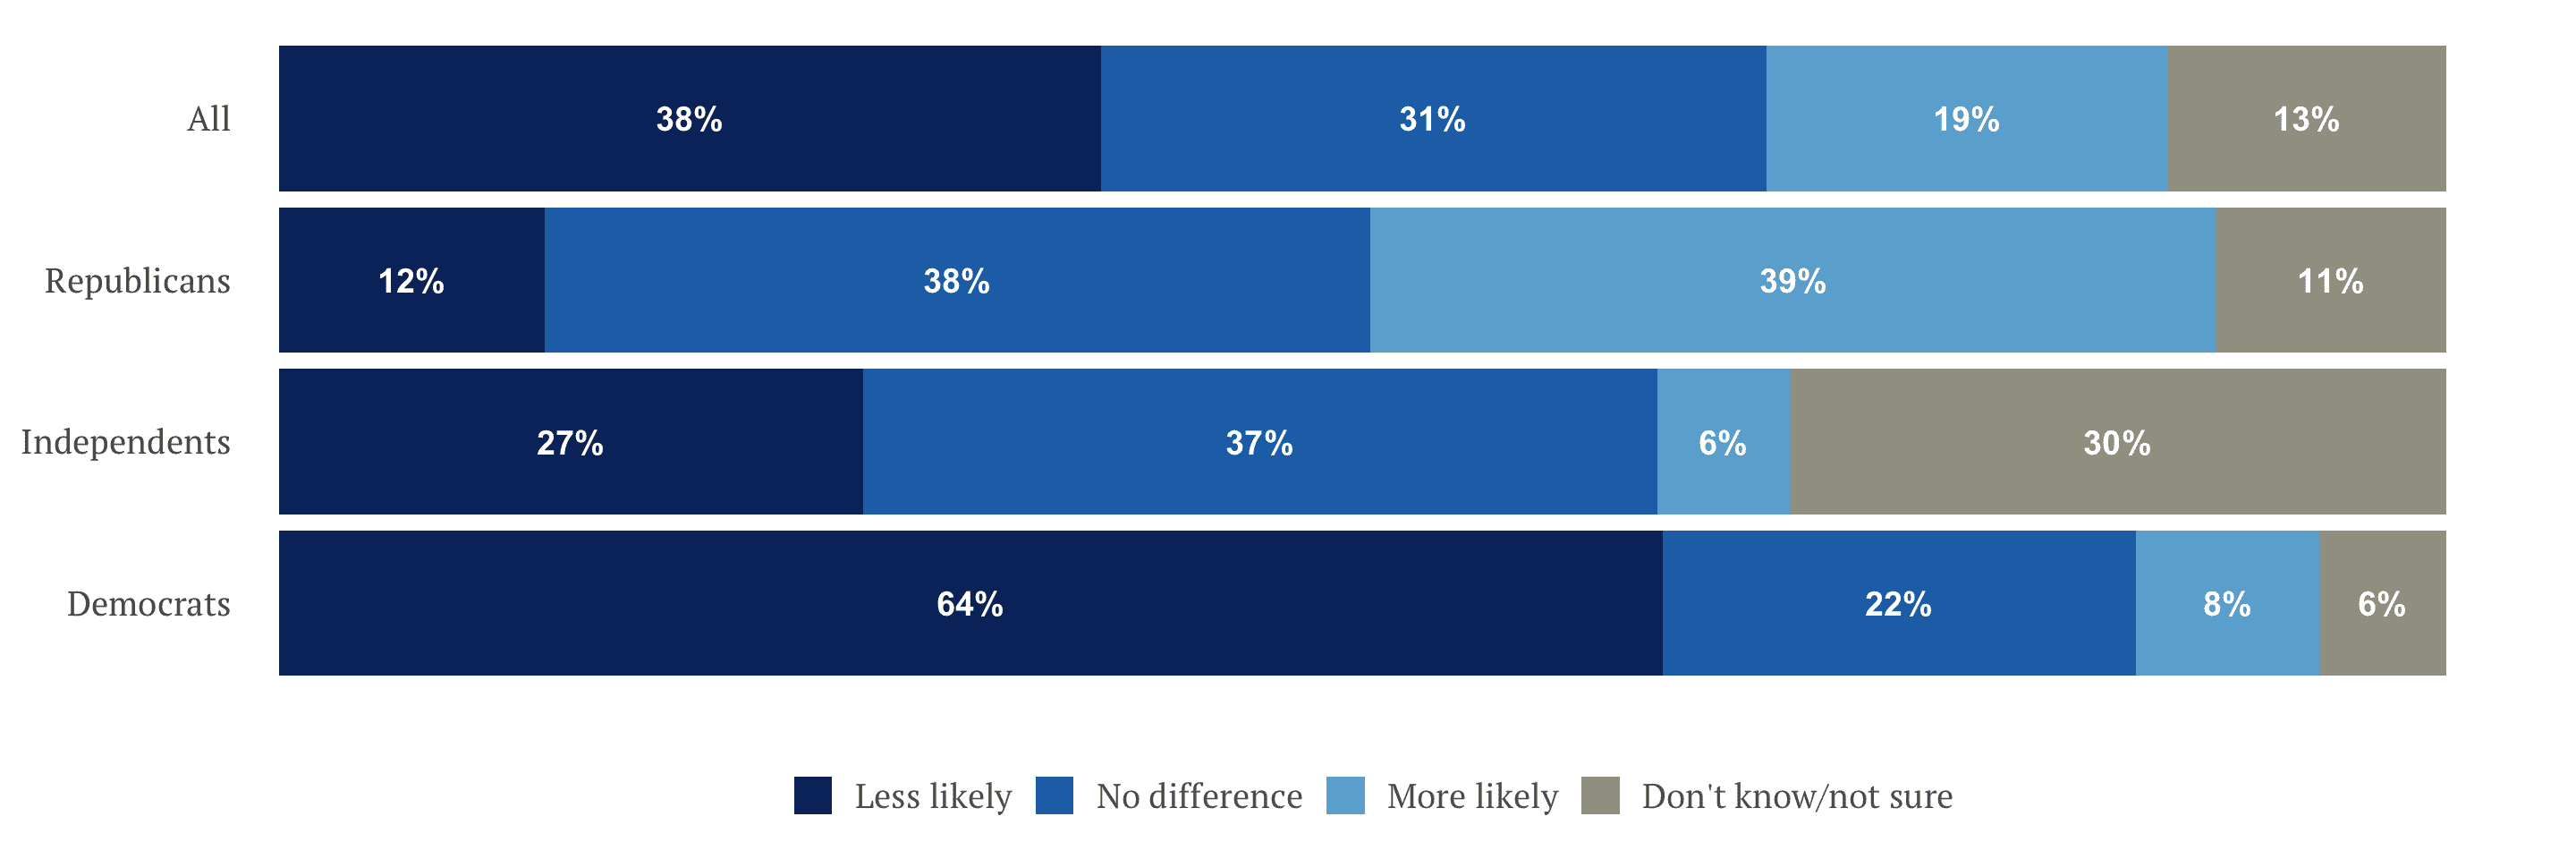
We asked about political candidates who say the 2020 election was rigged against Trump. A plurality of respondents (38%) said they would be less likely to vote for such a candidate. That was twice as many as the 19% who said they would be more likely to vote for such a candidate.
This gap was more pronounced among independents. Of those, 27% said they would be less likely to vote for a candidate who bought into the false claim of a rigged election. Just 6% of independents would be more likely to support an election-denying candidate.
“If a political candidate for office says they believe the 2020 presidential election was rigged against Donald Trump, would that make you [more likely to vote for that candidate, less likely to vote for that candidate], or would it not make a difference in your vote?”
Americans want Congress to support our elections.
Some members of Congress have proposed eliminating federal spending on election security grants. States use the money to replace outdated election equipment, put audit systems in place, and keep elections secure.
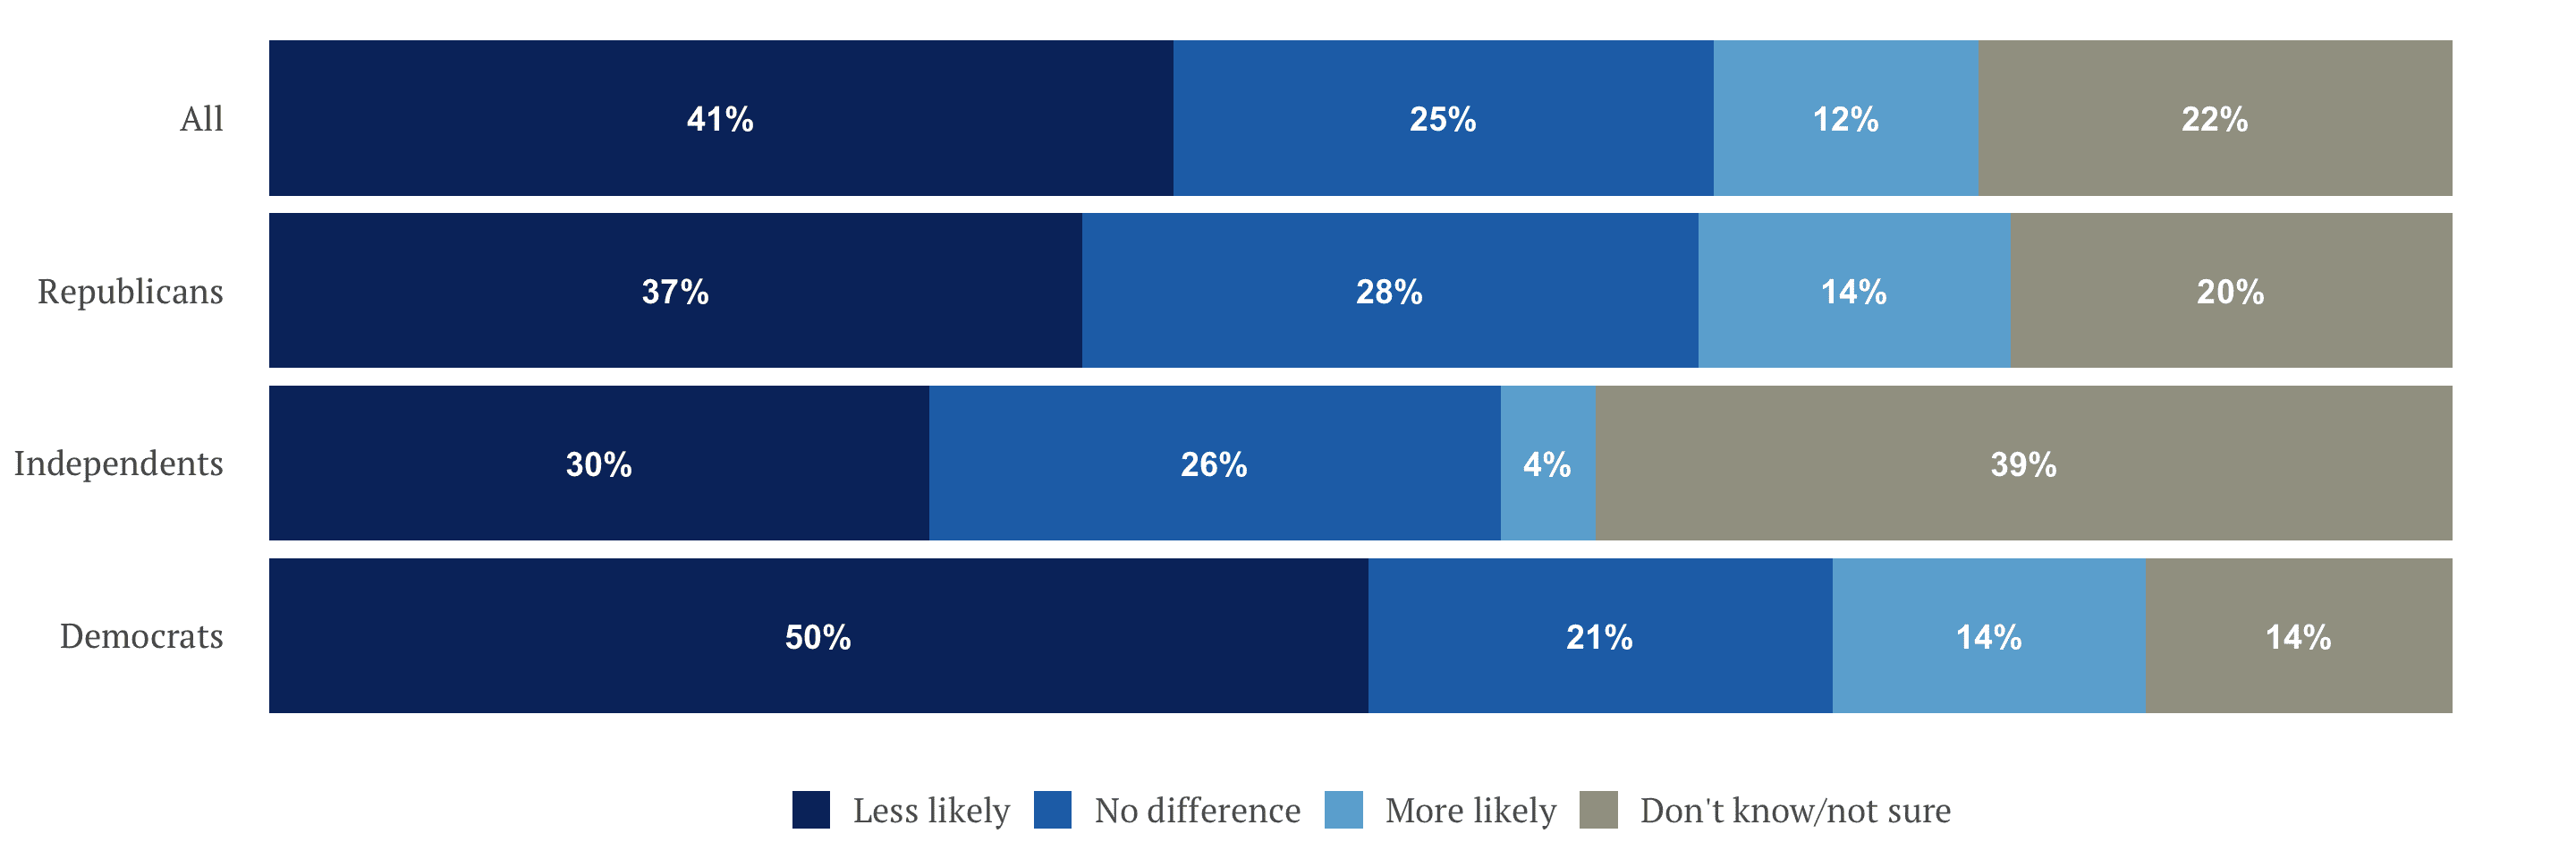
Americans want Congress to keep that support in place. A clear plurality of respondents (41%) said they would be less likely to vote for a representative who voted to cut election security grants. That was far higher than the 12% who would be more likely to support such a person.
The substantial gap showed up among all partisan groups. Thirty percent of independents said they were less likely to vote for a representative who voted to cut election security grants (compared to 4% who said they were more likely), and 37% of Republicans reported being less likely, compared to 14% who said they were more likely.
“Election security grants give states funding to improve how elections are run. The grants allow states to replace outdated election equipment, implement audit systems, and increase election security. This year, some members of Congress proposed a bill that would eliminate all federal spending on election security grants. If you knew your member of Congress voted to cut these grants, would you be [more likely to vote to reelect your representative, less likely to vote to reelect your representative], or would it not make a difference in your vote?”
Americans would be reassured by more information about counting and certification.
We gave respondents a list of types of information about how elections are run. Then we asked the respondents what might reassure them about the fairness, accuracy, and security of elections.
Americans of all stripes—Republican, Democratic, and independent—ranked information about counting and certification as the most reassuring, by wide margins. It was by far the most popular response, with 43% of voters putting information about how votes are counted and certified at the top of the list, ranking it as the most reassuring.
The next most popular answers were about information addressing specific claims of voter fraud, and information about how elections are monitored by members of the public.
“Below is a list of things that people have said they’d like to know more about to help build their confidence in how elections are run. Please rank the following types of information in order of how much they might reassure you about the fairness, accuracy, and security of our elections, with 1 being the ‘most reassuring’ and 6 being the ‘least reassuring.’”


People want to know more about election security steps.
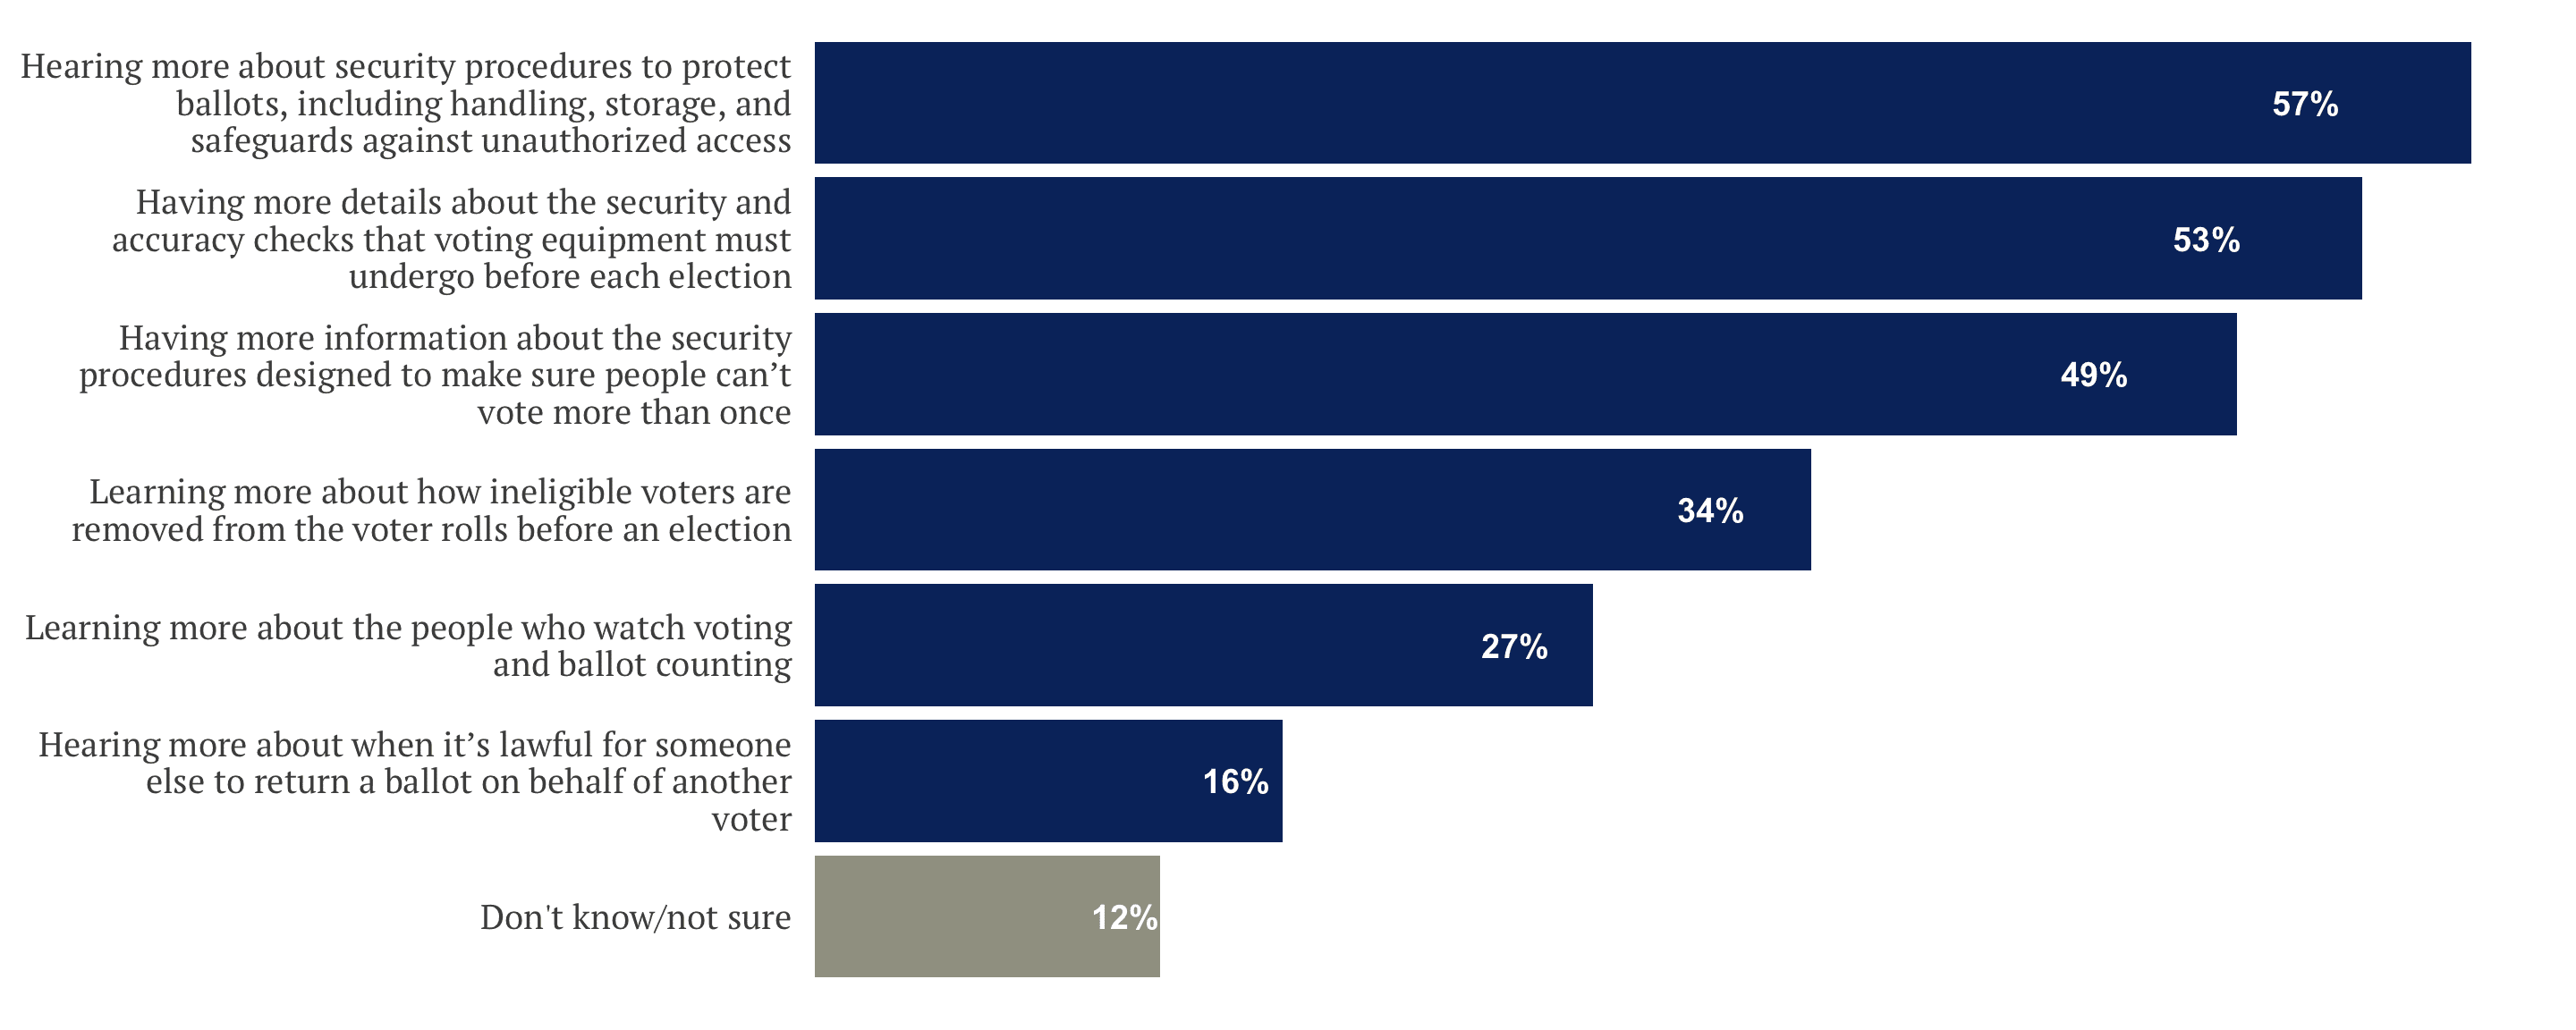
We also asked about a variety of topics about the voting process. We wanted to know what information would reduce Americans’ potential concerns about the process. Respondents could choose up to three answers.
The top choices were information about security procedures to protect ballots, information about security and accuracy checks for voting machines, and information about security procedures that make sure people can’t vote more than once.
The findings were fairly consistent across partisan groups. Republicans, Democrats, and independents all picked the same top three answers, although Republicans had a slightly different order.
“Below is a list of topics that some people would like to learn more about to answer their questions about whether the voting process in American elections is reliable, accurate, and secure. Among the options below, which do you think would be most helpful in reducing some of your potential concerns about the voting process? You may select up to 3.”
This survey is based on 1,518 interviews conducted by YouGov on the internet of U.S. adults from Dec 15-21, 2023. The sample was weighted according to gender, age, race/ethnicity, education, and U.S. Census region based on voter registration lists, the U.S. Census American Community Survey, and the U.S. Census Current Population Survey, as well as 2020 Presidential vote. Respondents were selected from YouGov to be representative of U.S. adults. The margin of error is approximately ± 2.7% and is larger for partisan subsamples.
Note: Numbers may not all add up to 100% because of rounding.